Recently, I experimented with the pre-training and fine-tuning of variable-width dynamic MLA models based on the dynamic hyper-network training architecture described in US-Nets. After analyzing the experimental data, I observed some noteworthy phenomena that I have yet to fully understand.
I trained two models as controls: ExpMLA-1 and DynaMLA-1. The former is a 336M-parameter model using a standard MLA architecture. It features 12 self-attention layers, each with 12 Q-heads and 4 KV-heads.
It employs the classic MLA architecture, consistent with the structure described in the Deepseek-V3 technical report. The Q projection matrix is compressed to 768 dimensions, and the KV projection matrix to 512 dimensions. Meanwhile, d_model is set to 1536.
Subsequently, DynaMLA-1 was trained; it shares the same base parameter configuration as ExpMLA-1, with 336M parameters. The compressed matrices were trained as a continuous, variable-width supernet in the style of US-Nets. The focus is on in-place distillation and the Sandwich Rule. At each step, the loss of the main network relative to the sequence data is computed, followed by soft distillation using the main network on two subnetworks: the lowest-tier subnetwork and a randomly selected intermediate-tier subnetwork. Three forward and backward passes are performed at each step.
Subnets are selected from a discrete bucket. In DynaMLA-1, the Q dimension has a greater impact on performance than the KV dimension due to its higher value. Buckets for the Q dimension and KV dimension are designed separately. They are:
- KV: {64, 128, 256, 384, 512}
- Q: {128, 256, 384, 512, 768}
The MLP dimention is calculated as:
max(d_kv, d_q) * 4
Following the above rules, after training for 12,000 steps with a 1:20 parameter-to-token ratio, the CORE Metric was tested for each dimension of the base model. The results are as follows:
- 64x128: 0.08736
- 128x256: 0.08910
- 256x384: 0.09855
- 384x512: 0.09896
- 512x768: 0.10253
In some sub-tasks, smaller subnets demonstrated stronger performance compared to larger ones. For example, on openbook_qa, the 256x384 subnet achieved a score of 0.288, while the 384x512 subnet only scored 0.286.
Surprisingly, ExpMLA-1, the control group based on the standard MLA architecture, achieved a score of only 0.0955 on the CORE Metric, underperforming compared to the 256x384 subnet. Variables such as the training dataset, batch size, and learning rate were all controlled to match the specifications of DynaMLA-1. Perhaps there is some unexplained mechanism at play in the training of nested subnets. Or it could simply stem from errors I have not yet identified.
Next, I conducted a confusion matrix test on all dimension combinations of DynaMLA-1 using a small dataset. The results are visualized in the heatmap below.
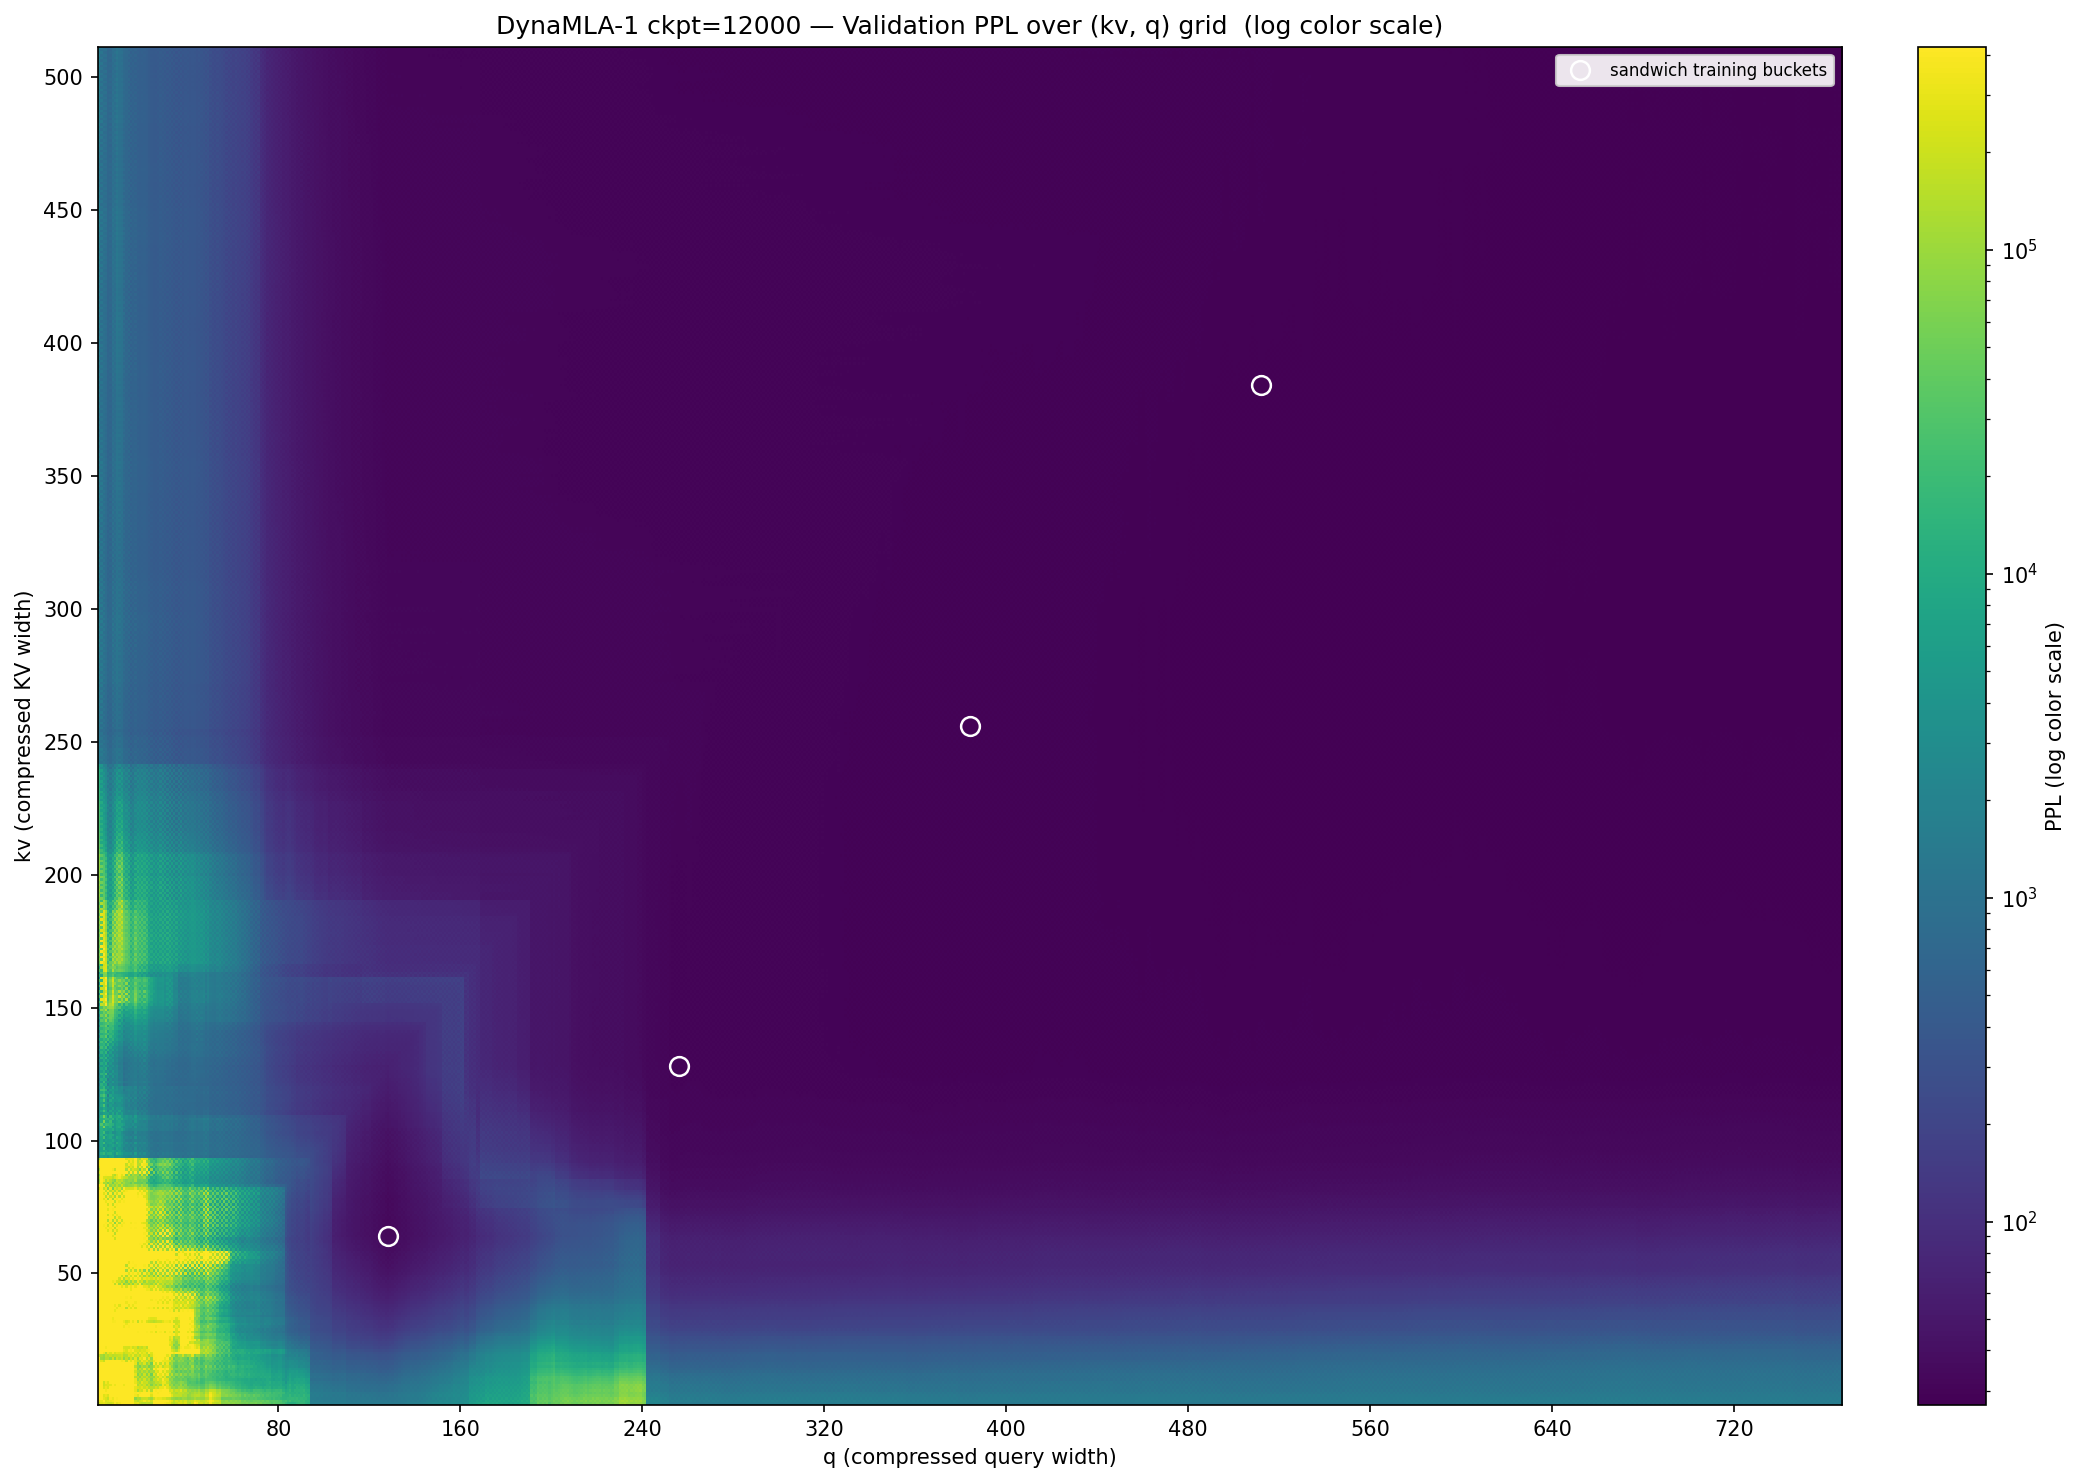
Several distinct patterns are observable in the figure. First, the importance of the Q dimension is indeed higher than that of the KV dimension. When the Q dimension falls below approximately 80, the subnet immediately enters an unusable range with a confusion score of around 1000. For the KV dimension, this threshold is lower; within the safe zone in the lower-left corner, the KV dimension can drop as low as approximately 30 while maintaining a confusion score below 100.
Another puzzling finding is the distinct cliff in the lower-left corner of the figure. When the Q dimension changes from 241 to 242, the perplexity undergoes an inexplicable phase transition. The following figure visualizes this process.
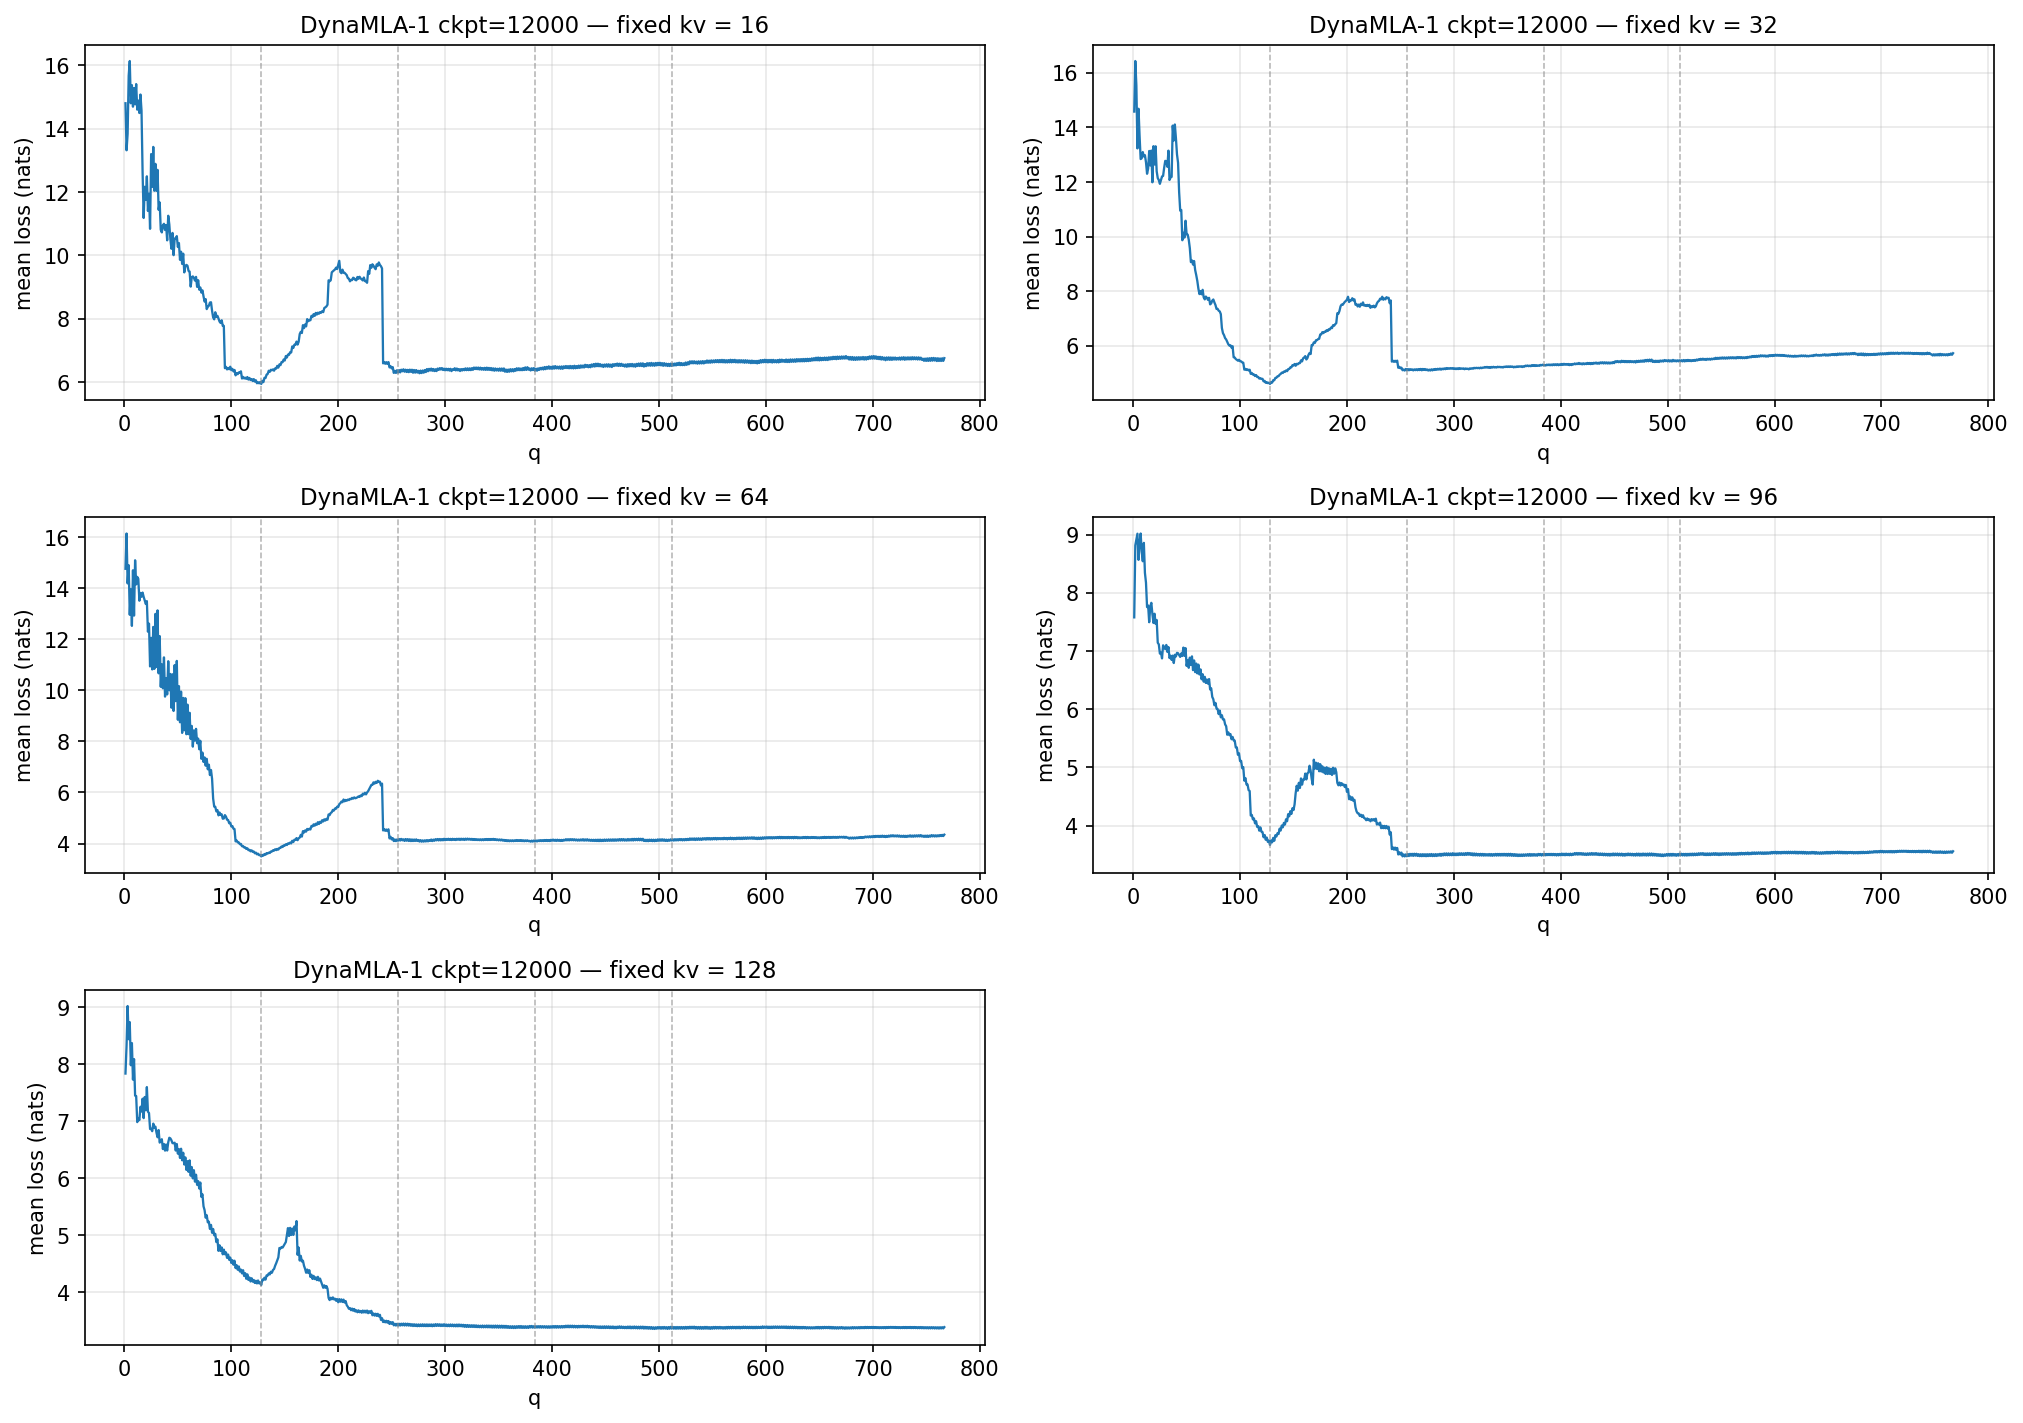
The cause of this phenomenon has not yet been identified; further experiments are currently being designed, with plans to incorporate a Matryoshka-style hypernetwork training mechanism—inspired by Matformer—for comparative analysis.